See why investors’ faith in the Fed to right the bond bear-market ship is misguided. And, where you should be looking instead.
What a difference a (almost) year can make. When investors rang in 2023, many mainstream experts predicted an across-the-board comeback in the battered global bond market. From Bloomberg on January 11:
“If Wall Street’s credit managers and prognosticators are right, 2023 will be the year that corporate bonds boom.”
And on February 25 “Bets on the Year of the Bond Are Still on Even as Losses Return.”
To clarify: A comeback in bonds is characterized by soaring prices and falling yields.
But flash ahead to today, and these optimistic outlooks have been thwarted as a historic bond bear market turns up again like a bad penny (or T-note). These recent headlines capture the extent of the damage:
- “The collapse in Treasury bonds now ranks among the worst market crashes in history” — Oct. 5 AP
- “In terms of total returns, this is the biggest bond market rout in 150 years. Last year was in fact US bond investors’ worst year since 1871.” — Oct. 9 Bloomberg
- “Bond market meltdown: What’s happening.” — Oct. 5 The Street
As for what stifled the widely expected bond market comeback, Markets Insider on November 7 echoes a very familiar mainstream refrain:
“Bond-market crash leaves big banks with $650 billion of unrealized losses as the ghost of SVB continues to haunt Wall Street. Treasury bonds — debt instruments the government issues to fund its spending — have been on a nightmarish run since the onset of the pandemic, with investors fretting about rising interest rates and the long-term viability of the US’s massive deficit.”
In sum: Bond yields have surged because the Fed added more than 5 percentage points to borrowing costs in the past 18 months.
Blaming Fed rate hikes for bonds’ rout is a tale as old as time.
But it’s a tale of fiction, one that becomes all too clear if you look at a long-term chart of bonds.
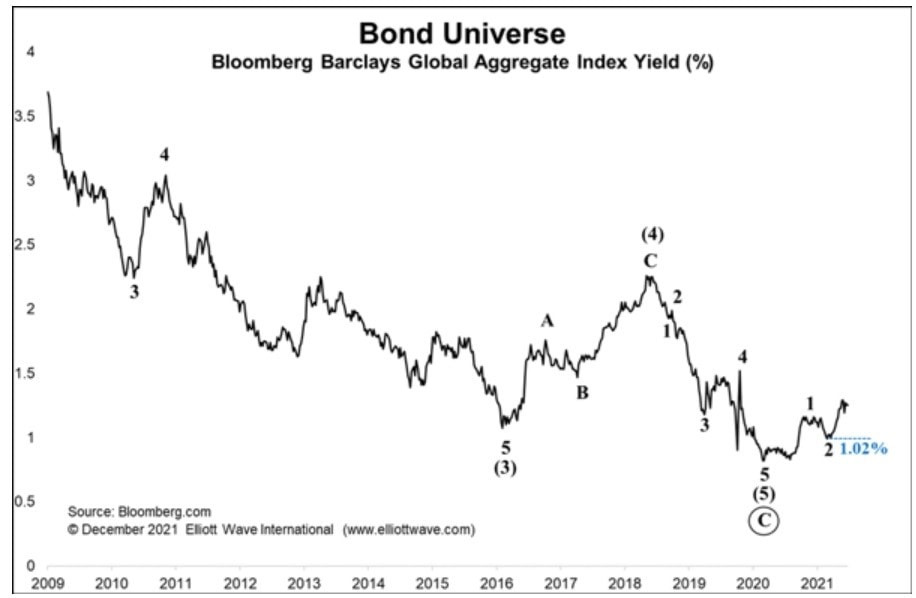
Here, in our December 2021 Global Market Perspective, we showed just that chart of the bellwether Bloomberg Barclays Global Aggregate Yield Index. There, our analysis identified a multi-decade-long selloff in bond yields (and rise in prices) as a completed Elliott wave decline at the 2020 low. There, Global Market Perspective warned subscribers that the next move of consequence for global bonds — from corporate to treasuries — would be higher yields:
“In terms of Elliott wave analysis, our modus operandi is that the yield on the Bloomberg Barclays Global Aggregate Bond Index is just starting wave 3 higher. If this is correct, we can expect yields across all sectors of bond markets to continue to rise well into 2022 (which, by definition, means prices will fall).”

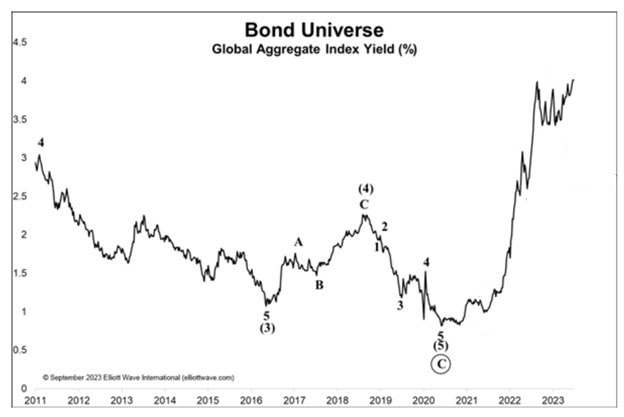
From there, the index’s yield went into a full-out sprint, soaring to multi-decade highs in what would become the first collective bond bear market since the first bank-issued credit card was invented in 1946.
What can’t be ignored is the fact that the upward reversal in yields occurred months before the Fed raised rates for the first time on March 17, 2022! Likewise, the UK’s equivalent Bank of England didn’t lift its own rates above .50% until March 2022.
The truth is the market had simply turned. Investor psychology had shifted from accepting lower interest rates to demanding higher ones.
The bull in bonds had no choice but to turn to bear, independent of the Fed’s machinations.
In the September 2023 Global Market Perspective, we updated our original chart of the Bloomberg Barclay’s Global Aggregate Yield Index, shown here:

The across-the-board trend change has spared no class of bonds. And still, the mainstream drumbeat continues to call on the Fed to right the bond bear-market ship.
That ship will not turn around until investor psychology does. And the first sign of that will appear in one place: directly on the price charts of the world’s leading bond markets.
A Service for Every Investor’s (and Trader, and Producer) Needs
Before the bearish reversal in bond yields, our Global Market Perspective subscribers were ready. Similarly, if you need our latest big-picture forecasts of forex, cryptos, stock indexes, metals, energy and more — 50+ markets in total — the latest, November Global Market Perspective delivers all that too, directly to your screen once a month for just $59.
Go from following market trends, to falling in line with their objective paths of least resistance.
