
The Nasdaq giant (COST) soars to record highs, and the mainstream experts divide. Elliott wave analysis solves the puzzle.
Looking for a way to pass the time for the next 10 or so years?!
A March 11 Reader’s Digest points to Costco’s newest novelty game: “The World’s Largest Jigsaw Puzzle.”
This Costco jigsaw puzzle contains 60,000 pieces broken up into 60 sections of 1,000 pieces each that all connect to create one giant puzzle. When finished, the What a Wonderful World puzzle measures 8 feet tall and 29 feet long.

Personally, I’d rather shovel out horse stalls on a hot summer day.
But, it brings me to an equally gigantic puzzle facing the investment world right now; namely, after the Nasdaq listee and retail giant Costco Wholesale (COST) rocketed to its highest level ever on June 10, is the stock out of its bullish runway?
The mainstream pieces don’t seem to fit together. Experts are divided across the board, as these recent news items show:
- 4 Reasons to Buy Costco Stock Like There’s No Tomorrow — June 9 Motley Fool
- Costco Stock: Is Its Premium Price a Prelude to a Fall? — June 9 Yahoo! Finance
- A Long-Term Play: Why Costco Stock is Poised for Growth, Cautious Buy — June 11 Seeking Alpha
- Costco’s Upside is Limited Due to Valuation — June 10 Yahoo! Finance
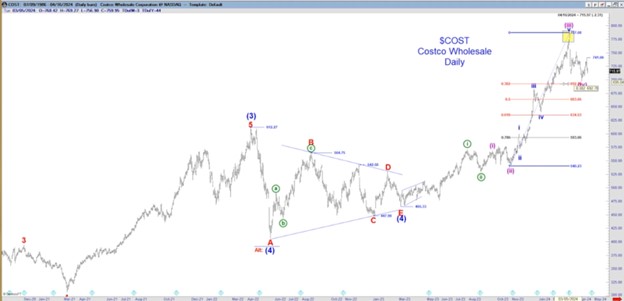
But, from an Elliott wave perspective, the big picture in COST is revealing itself one objective piece at a time. On April 17, our Trader’s Classroom presented the following labeled price chart of COST. It showed prices nearing the end of a fourth wave correction, setting the stage for a fifth wave rebound.
In commodities, fifth waves often extend up and out into the stratosphere. Said Trader’s Classroom:
Wave 4 is already about the size of wave 2, if not bigger actually, so it potentially is over.
It may be done correcting. We’ve got this pullback. It’s potentially large enough to be done, meeting 38% of the third wave. If Costco can take out this last high at 741, then maybe it’s back on its way up.
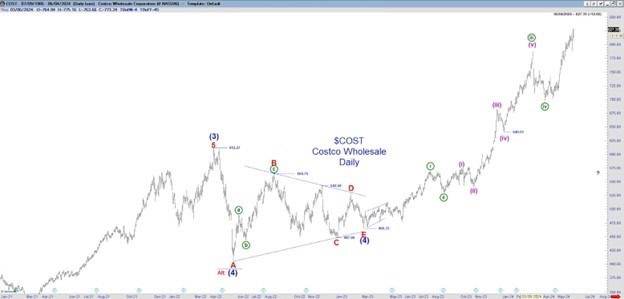
And, on April 19, COST touched bottom to embark on a powerful upsurge to record highs on June 10.
Now, on June 5, Trader’s Classroom revisited Costco (along with other leader board stocks such as Apple, Amazon, JP Morgan, and Microsoft) – with a newly labeled price chart. There, our analysis presented two possible scenarios for COST’s near-term future. But the bottom line is, this stock should reward just one group of traders in the long run. (Subscribers can watch the June 5 Trader’s Classroom video for full analysis; recent videos are archived.)
In the end, there’s no quick, fool-proof way to solve the puzzle of a market’s near-, and long-term future. But with the guidance of Elliott wave analysis, traders do have the critical levels of support and resistance to help keep them on the right track, with reduced risk.
Trading Lessons (Plus, Market Opportunities): 2 for 1
3 times a week, press “Play” and watch one of our 6 experienced analysts explain in comprehensive detail how to recognize the relevant Elliott wave patterns (and supporting technical indicators) underway now and in the future.
This is every Trader’s Classroom video in a nutshell: a lesson, often with a new opportunity in a wide swath of markets from individual stocks, cryptocurrencies, commodities, and more.
Here’s how to watch the latest lessons now.