OPEC’s “surprise” output decision lets the “bearish genie out of the bottle” — say mainstream oil experts. But that genie was let out months ago!
It’s prime time in Oilville. The reporters came out in droves to cover crude oil’s collapse to 4-month lows on June 4.
The lousy culprit?
Mainstream “market fundamentals” experts – the ones who stalk the news for clues as to why a market is falling or rising – managed to come to a consensus. To wit: Oil took a dive after OPEC announced on June 1 it was “leaving room” for some oil-producing nations to unwind their supply cuts if they should so choose.
Pretty vague, but the media ran with it like a dog to a chew toy:
- Oil drops as OPEC+ boosts supply even though demand is shaky – June 4 Reuters
- U.S. crude oil falls more than 3% as OPEC+ plans to phase out voluntary production cuts – June 3 CNBC
- U.S. crude oil extends losses on OPEC+ increasing supply later this year – June 4 CNBC
Noted CNBC:
U.S. crude oil fell more than 1% on Tuesday… to erase most of its gains for the year after OPEC+ announced plans to increase production starting in October.
U.S. crude has fallen for five consecutive sessions now, with the July contract tumbling 3.6% on Monday in the wake of the OPEC+ meeting last weekend.
In a surprise move, eight producers led by Saudi Arabia and Russia laid out a detailed plan to gradually phase out 2.2 million bpd of production cuts from October 2024 through September 2025, meaning oil supply will start increasing in the fourth quarter of this year.
If you compare the price levels at the end of last week to yesterday’s settlement prices it is almost obvious that the announcement of gradual reversal of voluntary cuts was chiefly responsible for letting the bearish genie out of the bottle.”
In fact, that genie was let out of the bearish bottle long before OPEC’s June 1 supply news.
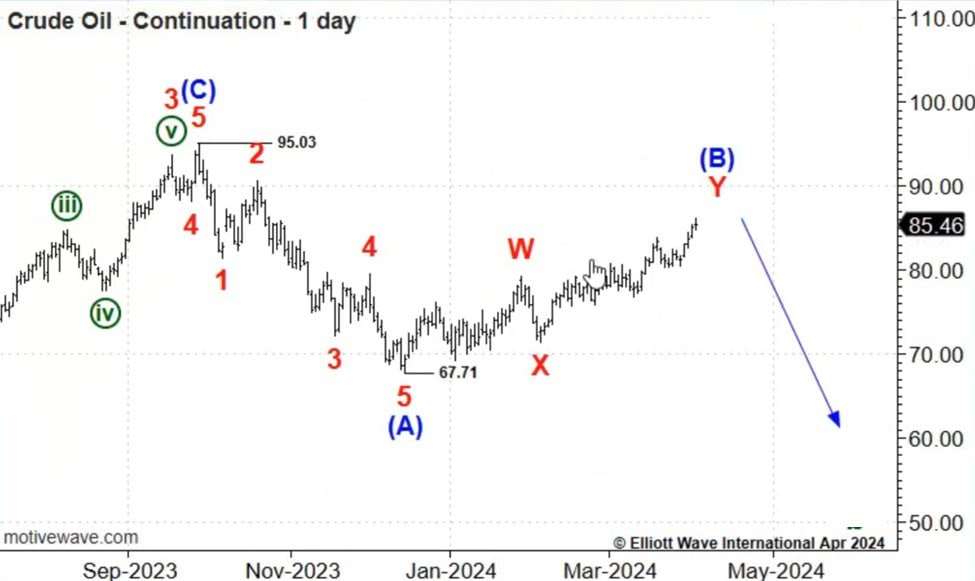
On April 5, our Energy Pro Service analyzed the oil market through the lens of Elliott waves, a.k.a. collective psychology of oil market participants – not external news events. And on that day in April, we showed a labeled chart of crude oil that showed prices near or at the end of a wave B rebound. “Late in development,” meaning the rally would likely continue; however, noted Energy Pro Service…
Look for resistance above today’s 87.63 rebound high around 89.18. If this is the operable wave count, wave (B) should terminate below the 95.03 wave ((X)) peak. I wouldn’t necessarily wait this long to make the call, but trade below 84.64 would open the possibility that a downward reversal is underway.

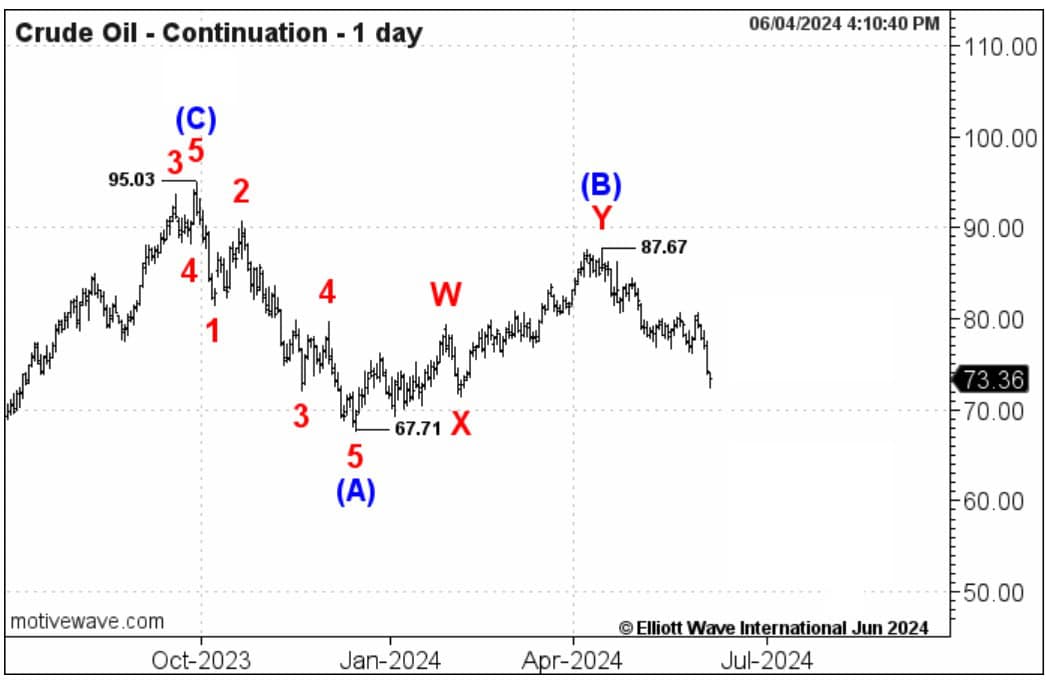
From there, crude wasted no time reversing its rally and turning down. In fact, oil has been falling since then, until tapping its lowest level in four months on June 4.

Just now, our Energy Pro Service chief analyst has posted new labeled price charts of crude oil that reveal a high-confidence set-up underway. Says the June 5 Energy Pro Service post:
“The bottom line is all the same.”
The next significant move may catch one class of oil traders off guard. Our Energy Pro Service identifies critical levels of support and resistance so no matter what, you won’t be in that class.
Oil, NatGas & More:
Energy Opportunities on Every Time Frame
For active traders watching the intraday, daily and weekly price movements in the energy markets, our Energy Pro Service presents detailed analysis that focus on meaningful developments underway in crude oil, natural gas, heating oil, unleaded and more.
Energy Pro Service helps you to shift from simply following market trends to predicting their objective paths of least resistance.
