Global Market Perspective (GMP) will show you the Elliott wave patterns and trends for the world’s most traded markets — stock indexes, forex, cryptos, interest rates, metals and energy, and more. The July issue puts the world of finance and economics in your hands like no other source can. Here’s two of the many examples you can have on your screen within minutes.
The Far Right’s Election Gains Rattle Europe’s Traditional Powers
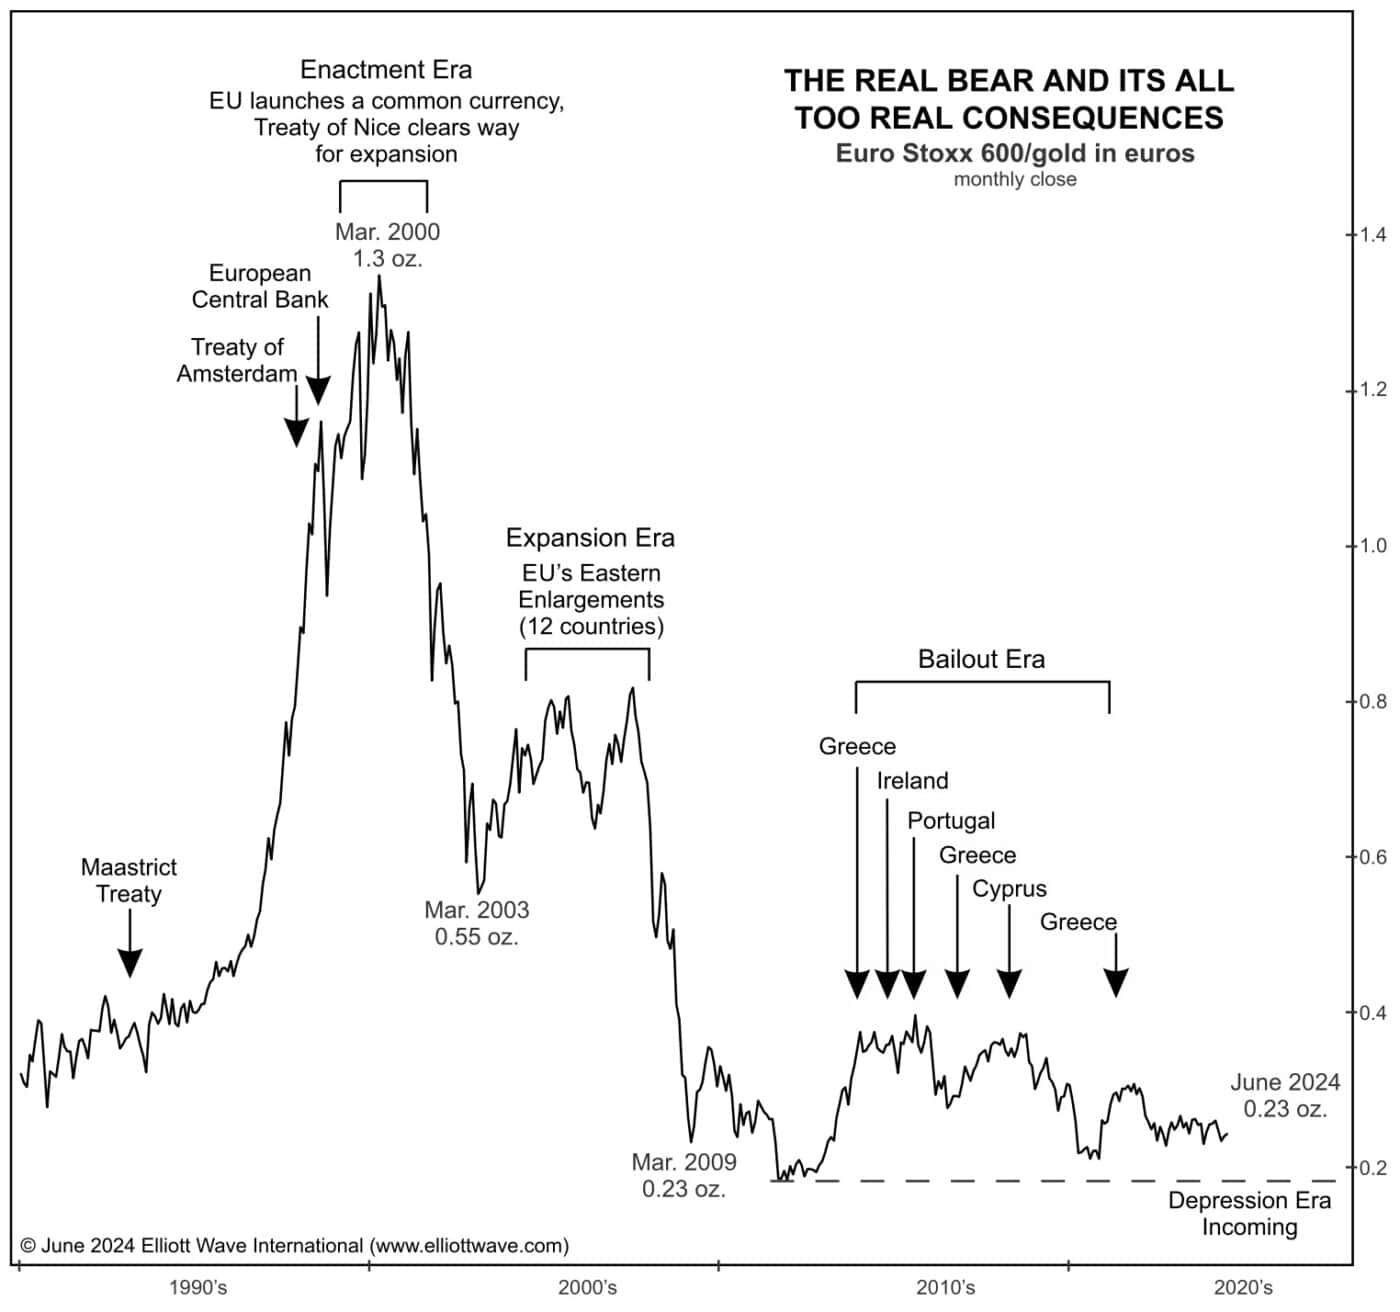
“Sometimes people ask me how stocks can be making new all-time highs when there are wars breaking out. Everyone’s angry. Everyone’s protesting everywhere. Socionomically, I think part of the explanation — granted not all of it, but part of it — comes from the perspective of the Stoxx 600/gold ratio. In real money terms, it’s an ongoing bear market, and it’s been that way for decades.”
That’s a recent quote from European Financial Forecast editor Brian Whitmer. Here’s his chart and commentary from the July GMP:
“The brackets and arrows capture the three most important eras of European evolution: the Enactment Era, which saw politicians establish a central bank, launch a common currency, and pave the way for Europe’s eastward expansion. Next came the Expansion Era, which lasted approximately three years from 2004 to 2007 and saw Europe undergo its largest enlargement in terms of people and land mass since the Middle Ages. Then came the Bailout Era, which arrived after another bear market and saw officials toil to save the eurozone from a series of sovereign debt crises. Finally, the Depression Era. It’s the next logical socionomic step, and it should persist at least as long as the mania that preceded it. During this era, the same nation states that viewed the EU as an advantage when social mood was waxing positive will come to see membership as a liability.”
Today’s most overlooked financial news story:
The Before & After Psychology of “Peak Equity Allocation”
You have to admire the conviction of U.S. investors. U.S. investors are certain the bull market in stocks will continue and they have acted on what they believe — indeed their certainty is measurable in the financial assets allocated to stocks. That allocation today stands at a new, all-time record of 34.7 percent. The chart below shows you this metric across the past 70-plus years. Note well the peaks in 1968, 2000, 2007, and 2021. Yes, those previous peaks each stood near a 30 percent allocation. But now please look again at what followed each of those peaks: A devastating decline in stock prices.
Get Your Roadmap to Global Risks and Opportunities
You just read two examples from Global Market Perspective, yet there’s so much more: 15 dedicated analysts track all the most important financial markets at every degree of trend — from intraday ticks to epic price waves that unfold across decades.
Read and see it all within moments.